Influencing the Quality of Outpatient SUD Care: Alerts and Incentives
Share

Financial incentives for quality improvement and timely performance feedback to treatment agencies are two potentially effective strategies for improving treatment quality. Until now, treatment for individuals with substance use disorders (SUDs) has been the focus of only a few studies using these strategies. Therefore, we examined the effects of these interventions by randomizing outpatient substance use treatment agencies in Washington State into four research arms that receive one, both, or neither of these interventions. Expanding the focus of empirical work on incentives and feedback is essential in light of the need to improve quality of treatment for individuals with SUDs, as well as ongoing interest in payment reform at state and national levels. In this article, we first describe the approach that we, researchers from Brandeis University and Washington State, designed with input from providers; we then share our results; and finally we discuss providers’ reactions to the interventions.
Financial Incentives
The rationale behind financial incentives is that payment is contingent upon meeting specified performance levels on a set of specified quality measures, and that organizations respond rationally to those incentives (Damberg et al., 2014). Pay-for-performance (P4P), a general term for initiatives that are focused on quality improvement, has been adopted as an approach to quality improvement by both private and public payers (CMS, 2011; James, 2012). Because most of the work on the impacts of incentives has been in general medicine, it is important to examine whether the use of P4P influences quality of behavioral health care.
Feedback through Reports of Performance, Alerts, and Reminders
Another approach that has been used for quality improvement is delivery of electronic reminders to health care providers to indicate when clients are in danger of not receiving targeted services on a timely basis. The most effective prompts and alerts are patient specific, come from well-respected leaders, and include evidence-based advice. These alerts are provided before patient appointments and delivered at an appropriate point in the clinical workflow to make it easy for providers to act on the information received (Dexheimer, Talbot, Sanders, Rosenbloom, & Aronsky, 2008; Feldstein et al., 2006).
Target Performance Measure
We focused on treatment engagement, a quality measure that has been included in the National Committee for Quality Assurance’s (NCQA’s) set of HEDIS measures (NCQA, 2017) and adopted by the National Quality Forum (NQF; NQF, 2012) and federal agencies such as the Centers for Medicare and Medicaid (CMS) and the US Department of Veterans Affairs (VA). The NCQA definition combines initiation and engagement in a two-part measurement:
- Initiation of AOD Treatment: Percentage of patients who initiate treatment through an inpatient alcohol or other drug (AOD) admission, outpatient visit, intensive outpatient service, or partial hospitalization within fourteen days of the diagnosis
- Engagement of AOD Treatment: Percentage of patients who initiated treatment and who had two or more additional services with a diagnosis of AOD within thirty days of the initiation visit
In this study, we focus only on engagement and include only clients who are admitted to outpatient or intensive outpatient treatment in specialty settings. Meeting engagement criteria is associated with positive client outcomes like reduced substance use and criminal justice involvement, improved employment status among public-sector clients (Dunigan et al., 2014; Garnick et al., 2014; Garnick et al., 2007; Garnick et al., 2012), and improved outcomes among VA clients (Harris, Humphreys, Bowe, Tiet, & Finney, 2010; Harris, Kivlahan, Bowe, Finney, & Humphreys, 2009).
Study Goals
In spite of mixed findings on the effectiveness of P4P, it remains a popular payment method with private and public payers as an approach to quality improvement. The evidence on the use of feedback and alerts has also resulted in modest improvements (Ivers et al., 2012). Our goal was to explore the impact on treatment engagement of implementing these two interventions in Washington State: financial incentives and a client-specific alert system.
Methods
For this study, Washington State agencies providing publicly-funded outpatient (including intensive outpatient) substance use treatment in specialty settings were randomized into four study arms: incentives, alerts, incentives + alerts, and a control arm receiving no intervention. The interventions were implemented simultaneously at agencies on October 1, 2013. Clients admitted to programs in the five quarters prior to the intervention date (i.e., July 1, 2012 to September 30, 2013) formed preintervention groups, and clients admitted from the intervention start date through December 31, 2015 formed intervention groups. We included thirty-nine agencies assigned to the incentives arm, thirty-seven to the alerts arm, thirty-nine to the incentives + alerts arm, and thirty-six to the control arm. Our analyses included 27,960 admissions in the preintervention period and 48,084 in the intervention period.
Client treatment data were obtained from Washington’s long-established administrative data system, the Treatment Activity Report Generation Tool (TARGET) for individuals receiving publicly-funded substance use treatment. TARGET provided information on the dates and types of services as well as information on demographics, employment, housing status, substance use history, and current substance use.
Incentives
Building on approaches also used in the federal government (CMS, 2007; James, 2012), we based the amount of financial incentives that agencies were eligible to receive each quarter on earned points, which took into account each agency’s engagement rate in that quarter compared to a target benchmark and improvement from its own performance baseline.
Agencies in the incentives and in the incentives + alerts arms could earn zero to ten points based on quarterly performance. Each agency’s incentive payment was based on the higher of the two scores:
Achievement
Achievement scores were assigned based on the position of an agency’s engagement rate relative to two values: a threshold value (76 percent) and a benchmark value (90 percent). To earn any achievement points in a quarter, an agency would have to have a minimum engagement rate of 76 percent in that quarter. This number was chosen as it was the fiftieth percentile of all agencies’ engagement rates. If an agency’s engagement rate in a quarter was higher than 76 percent, then they would earn one to ten points depending on how close their engagement rate was to the benchmark of 90 percent. We chose a 90 percent engagement rate as the benchmark because that was the ninetieth percentile of all agencies’ engagement rate at the beginning of the study. If an agency’s engagement rate was lower than 76 percent, they would not earn any achievement points.
Improvement
If an agency improved their engagement rate compared to their baseline value, they could earn a score of one to nine, depending on the amount of the improvement. An agency earned an improvement score of zero if its rate was below its own baseline value (i.e., no improvement).
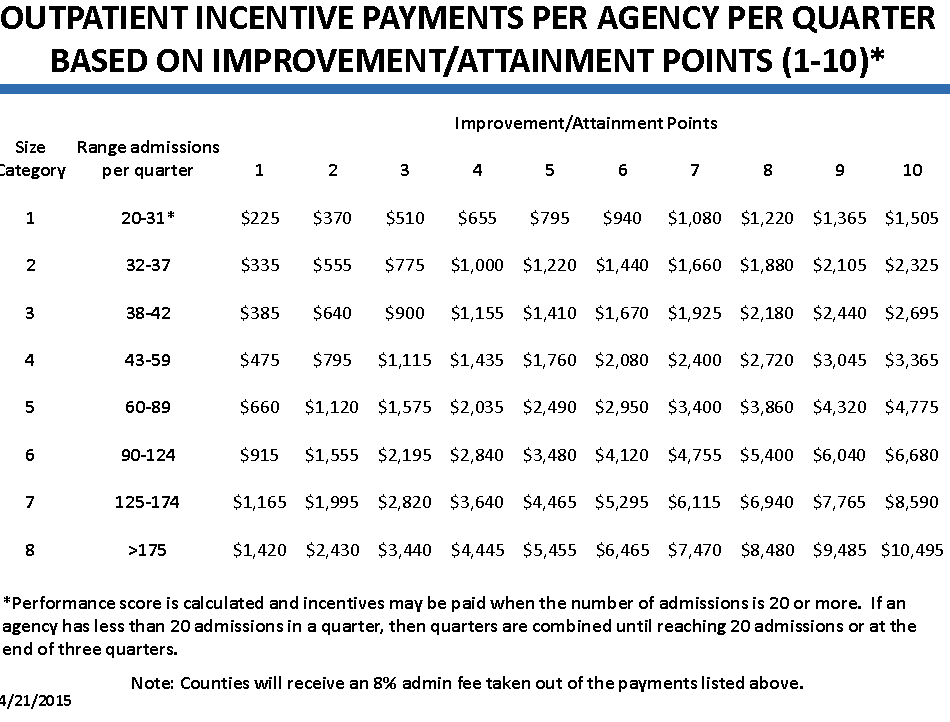
The following example illustrates how the points and incentives were applied. Outpatient Agency “A” had a baseline engagement rate of 40 percent. In one quarter during the intervention, Agency A had an engagement rate of 54 percent. It did not earn achievement points because it did not reach the 76 percent minimum threshold. However, it earned two improvement points for improvement from 40 percent (their baseline engagement rate) to 54 percent (their engagement rate in the quarter). Based on the payment table in Figure 1 (Washington State DSHS, 2015), Agency A earned $1,120 that quarter.
Alerts
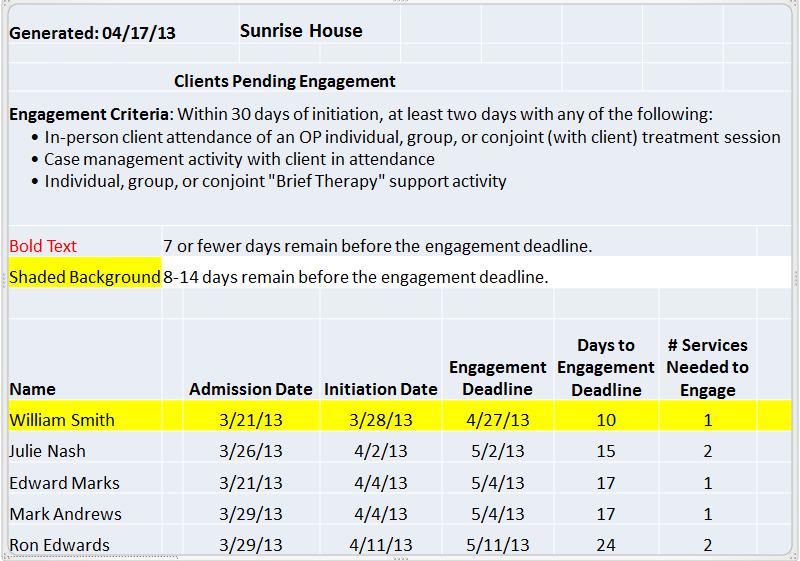
Weekly alerts were sent by the Washington State Division of Behavioral Health and Recovery (DBHR) to agencies. These alerts were in the form of an Excel workbook with information about clients newly admitted in the agency and their deadline for meeting initiation or engagement criteria was approaching. The alerts showed clients’ names, initiations, engagement deadlines, the number of days until the deadlines, and the number of additional outpatient service days needed for clients to meet criteria for initiation or engagement. While not the focus of the incentives, initiation is included because without meeting the initiation deadline, clients cannot meet the engagement criteria. In the hypothetical example illustrated in Figure 2, a treatment provider could see that “William Smith” needed one more service in the following ten days to meet treatment engagement criteria.
Analyses
We first conducted descriptive analyses of clients who were admitted to treatment at the participating agencies in the preintervention and intervention periods. We also used a multilevel logistic regression model to examine the effect of the interventions after taking into account client and agency characteristics. With the goal of gaining insights into quantitative results, after the implementation period ended, we conducted a focus group and semistructured phone interviews to gather feedback from agencies regarding the study interventions, how the interventions may have been improved, and perspectives on why the interventions may not have had the desired impact on performance. The focus group was attended by eleven agency staff representing nine agencies. Phone interviews were conducted with seventeen staff members from sixteen agencies, yielding a total of twenty-eight individuals who provided feedback regarding the study and its interventions.
Impact of the Interventions
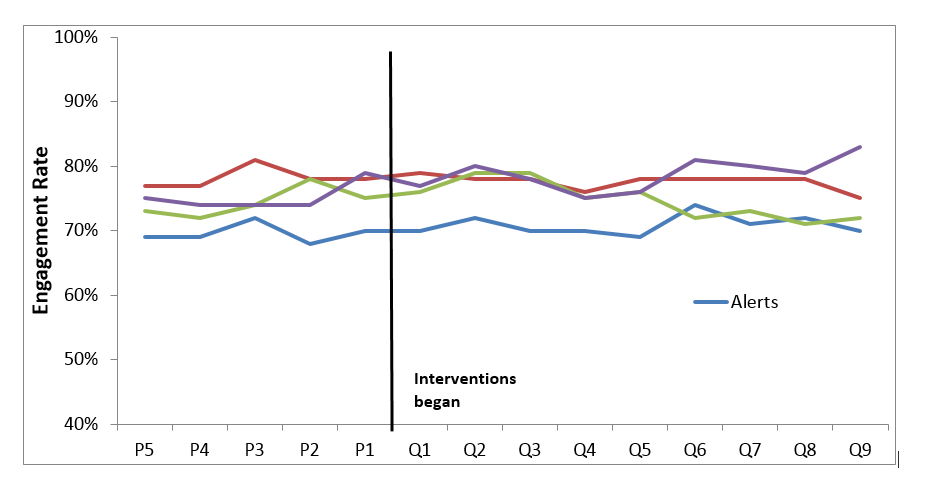
Despite focusing on two promising approaches to improving the quality of treatment for SUDs, we found no evidence that incentives or alerts led to better client engagement in treatment. There were no significant effects of the incentives only, the alerts only, or incentives + alerts on treatment engagement compared with the control group that had neither of those interventions. We found that quarterly engagement rates do not change between the preimplementation and the implementation periods. This can be seen in Figure 3, which shows quarterly that engagement rates do not change between the preimplementation and the implementation periods. We drew the same conclusions from the regression analyses.
Quarterly Engagement Rates During PreImplementation and Implementation
These results may not be surprising given the fundamental implementation challenges and contextual factors accompanying the project. In our focus group and post-study interviews with agency staff, we heard many similar comments regarding relevant design features, implementation issues, treatment agency factors, and external factors affecting the effectiveness of our intervention in Washington State.
Effects of Design Features
Several key design features of incentive payment systems can impact effectiveness (Eijkenaar, 2012, 2013; Horgan, 2012; Rosenthal & Dudley, 2007), and they are:
- The selection of performance measure
- Incentive design
- The nature of the incentive target
- Payment size
Selection of Performance Measure
We selected treatment engagement as the target performance measure because it is nationally endorsed (CMS, 2014; NCQA, 2016), is widely used, has evidence of being linked to outcomes, and is relatively simple to understand and track. However, for years Washington State’s contracts with agencies had included a different performance measure: retention in outpatient treatment. Many agencies may have viewed this retention measure as easier to achieve since it required only one visit per month for three consecutive months, and agencies may have focused on the retention measure because it was in their contracts throughout the study period.
Incentive Design
In designing the incentive payment structure, agencies were given the higher of two scores: how well the agency performed relative to all Washington outpatient agencies (called the “achievement score”) and how well the agency performed relative their own baseline performance (called the “improvement score”). This approach recognizes that agencies that already have high engagement rates had less room and less need to improve, and at the same time it avoids the issue of low-performing agencies not being sufficiently motivated. We selected the ninetieth percentile of all agency engagement rates as the benchmark. We received comments regarding the incentives from agencies in a poststudy focus group and phone interviews. While the incentives did motivate some agencies to make changes to improve their performance, others expressed that the incentives did not change their behavior since they always try to do their best to engage clients regardless of incentives. One agency expressed that better salaries is what it takes to improve performance and not incentives; several agencies thought incentivizing clients would make more of a difference than incentivizing agencies; and one agency thought free staff training would be better than financial incentives.
Nature of Incentives Target
We aimed the incentives at treatment agencies rather than clients or clinicians because we wanted to give agencies the choice to use potential incentive payments in the manner they felt was most appropriate, including the possibility of distribution to staff or clients. However, in poststudy focus groups and interviews, some agency staff expressed a sense that incentivizing clients would have been more effective.
Size of Payment
The state allocated a substantial sum (i.e., $1.5 million) towards incentive payments and, in the hope of maximizing the effects of these payments, the study designed them to be distributed on a quarterly basis and to be based on agency size and performance. Poststudy interviews indicated that while some agencies expressed that a larger incentive would have had more of an impact on performance, most felt that the size of the incentive did not make a difference as they just wanted to do the best for their clients.
Implementation Issues
The lack of impact also could have been caused by how the project was implemented.
Alert Implementation
We found that the percent of alerts opened began higher and decreased over time and that the motivation to open the alerts was lower when there was not the possibility of financial incentives. Also, lags in data submission to the TARGET system made the alerts less useful to agencies, with several agencies reporting that the data from the TARGET system were out of date by the time they received it.
Incentive Implementation
Our goal was to calculate incentive payments on a quarterly basis and to make payments as quickly as possible. This goal was thwarted at two key junctures. First, final quarterly rates could not be calculated until seven weeks after a quarter ended because of the need to allow forty-five days to pass after the end of the quarter (from an initial treatment admission to possible initiation visit in thirty days), as well as data lag in reporting to TARGET. Second, payments were administered through the counties that managed the outpatient agency contracts, resulting in additional delays.
Treatment Agency Factors
Perhaps the most important element in the success of an incentive or alerts initiative is how agencies respond on an organizational level. The reaction we heard most often was that treatment agencies are stressed and have multiple competing demands for staff time and attention. Agencies also told us that staff turnover and limited staff time affect the results of the interventions. Furthermore, staff time is limited to deal with the alerts and following up with clients nearing the end of their time period for engagement.
Treatment System Issues
When we conceptualized this project and applied for funding in 2011, we did not foresee that Washington would be ramping up for significant changes in their treatment system, or anticipate the changes in the clients presenting for treatment. In addition, perennial issues outside the control of treatment agencies affected their ability to engage clients.
Until recently, the State provided physical health, mental health, and SUD services to Medicaid enrollees through three separate systems. Following legislative actions in 2014, mental health and SUD services were integrated on April 1, 2016, with the plan to fully integrate physical health and behavioral health by January 1, 2020. A number of agencies expressed that they have been in crisis mode with funding cuts and trying to keep up with changes, and therefore have had no time to focus on the interventions.
Our project coincided with a period of national transition as well. The Affordable Care Act (ACA) allows states to expand Medicaid to individuals who were previously ineligible, such as single adults without documented disabilities. However, agencies reported that Medicaid regulations are limiting. Outreach efforts that have the potential to get clients to come back for treatment (e.g., follow-up calls, going into neighborhoods and knocking on doors) are not Medicaid-reimbursable activities. Also, it is a “Medicaid rule” that in order to bill for otherwise allowed services, the people who call clients for scheduling need to be chemical dependency professionals (CDPs). This requires clinical staff time that might otherwise be committed to other things.
At the same time, many agency staff reported that incentives are not sufficient in the face of client issues that cannot be controlled by the agency, such as client lack of motivation, barriers to treatment (e.g., lack of transportation and insurance coverage, or housing instability), and client contact information that gets outdated quickly, complicating client follow-up.
Limitations
The main limitations to our study are the lack of generalizability, since the study was conducted only in one state; the lack of data on medication-assisted treatment (MAT); and analysis of data only from the public sector specialty treatment system. It could be that the impact of the interventions may be different in other settings or during a more recent time period. For example, alerts may be more effective in settings with electronic health records (EHRs) where they could be incorporated into real-time (rather than weekly) follow-up reminders. Moreover, it appears that the electronic reminders were not utilized as planned, given agencies’ technological and resource restraints. Thus, it is unclear whether the lack of an effect was due to ineffectiveness of the intervention or to it not being utilized by some of the providers.
Conclusions and Policy Implications
In Washington state, implementing incentives and alerts had no impact on engagement into outpatient treatment. Design of a fair and effective P4P program is a complex undertaking and we found that even following many recommended design paths did not ensure success. Moreover, the large investment in implementation in terms of state personnel time and commitment of funds for incentive payments, along with federal grant support, was not sufficient to ensure improvement. This raises the possibility that incentive payments and alerts by themselves may not be the most promising approach to improving performance for SUDs in public-sector settings.
One important lesson is that P4P be considered not only as a stand-alone approach, but rather as one element in a broader effort to drive quality improvement that might include multiple elements such as client-focused supports (e.g., provision of transportation to treatment or recovery coaches), strengthened support of treatment agencies (e.g., staff training or upgrades of health information systems that could make information available in real time), or different design of incentives (e.g., offering incentives directly to clients). Going forward, these improvements in client-focused supports, workforce, and technology are important areas to focus on along with questions such as how improvements, when achieved, can be sustained over time and whether use of performance measures has any unintended consequences.
Another important lesson is to consider the influence of a changing health care landscape when considering incentives, alerts, or other approaches to improving quality. In Washington State in particular, treatment agencies were preoccupied with Medicaid expansion, planning for integration of mental health and SUDs into regionally managed behavioral health organizations (BHOs), and positioning themselves for full integration with medical services in 2020 under a managed-care model. Moreover, at the time of the study, the treatment system may have lacked the capacity to effectively respond to alert and incentives.
In sum, states should evaluate their health system context in terms of whether they will support improved quality in terms of agency- and state-level health information technology or the ability to attract sufficient numbers and skill levels for an adequate treatment workforce. Perhaps only in the context of a well-functioning treatment system, and in concert with a range approaches, will P4P emerge as a useful tool to drive quality improvement.
Acknowledgments
This research was supported by the National Institute on Drug Abuse (NIDA) of the National Institutes of Health (R01DA033468) and is a component project of the NIDA-supported Brandeis/Harvard Center to Improve System Performance of Substance Use Disorder Treatment (P30 DA035772). The content is solely the responsibility of the authors and does not necessarily represent the official views of the National Institutes of Health or of Washington State. The authors appreciate the contributions of Can Du, Alice Huber, Eric Larson, Sharon Reif, Maureen Stewart, Katie Weaver-Randall, and Fritz Wrede.
References
- Centers for Medicare and Medicaid Services (CMS). (2014). Clinical quality measures for 2014 EHR incentive programs. Retrieved from https://www.cms.gov/regulations-and-guidance/legislation/ehrincentiveprograms/downloads/2014_ep_measurestable_june2013.pdf
- Centers for Medicare and Medicaid Services (CMS). (2007). Report to Congress: Plan to implement a Medicare hospital value-based purchasing program. Retrieved from https://www.cms.gov/Medicare/Medicare-Fee-for-Service-Payment/AcuteInpatientPPS/downloads/HospitalVBPPlanRTCFINALSUBMITTED2007.pdf
- Centers for Medicare and Medicaid Services (CMS). (2011). Premier hospital quality incentive demonstration: Rewarding superior quality care. Retrieved from https://www.cms.gov/Medicare/Quality-Initiatives-Patient-Assessment-Instruments/HospitalQualityInits/Downloads/HospitalPremierPressRelease-FactSheet.pdf
- Damberg, C. L., Sorbero, M. E., Lovejoy, S. L., Martsorf, G., Raaen, L., & Mandel, D. (2014). Measuring success in health care value-based purchasing programs: Summary and recommendations. Retrieved from https://www.rand.org/content/dam/rand/pubs/research_reports/RR300/RR306z1/RAND_RR306z1.pdf
- Dexheimer, J. W., Talbot, T. R., Sanders, D. L., Rosenbloom, S. T., & Aronsky, D. (2008). Prompting clinicians about preventive care measures: A systematic review of randomized controlled trials. Journal of the American Medical Informatics Association, 15(3), 311–20.
- Dunigan, R., Acevedo, A., Campbell, K., Garnick, D. W., Horgan, C. M., Huber, A., . . . Ritter, G. A. (2014). Engagement in outpatient substance abuse treatment and employment outcomes. The Journal of Behavioral Health Services & Research, 41(1), 20–36.
- Eijkenaar, F. (2012). Pay for performance in health care: An international overview of initiatives. Medical Care Research and Review, 69(3), 251–76.
- Eijkenaar, F. (2013). Key issues in the design of pay for performance programs. The European Journal of Health Economics, 14(1), 117–31.
- Feldstein, A., Elmer, P. J., Smith, D. H., Herson, M., Orwoll, E., Chen, C., . . . Swain, M. C. (2006). Electronic medical record reminder improves osteoporosis management after a fracture: A randomized, controlled trial. Journal of the American Geriatrics Society, 54(3), 450–7.
- Garnick, D. W., Horgan, C. M., Acevedo, A., Lee, M. T., Panas, L., Ritter, G. A., . . . Wright, D. (2014). Criminal justice outcomes after engagement in outpatient substance abuse treatment. Journal of Substance Abuse Treatment, 46(3), 295–305.
- Garnick, D. W., Horgan, C. M., Lee, M. T., Panas, L., Ritter, G. A., Davis, S., . . . Reynolds, M. (2007). Are Washington Circle performance measures associated with decreased criminal activity following treatment? Journal of Substance Abuse Treatment, 33(4), 341–52.
- Garnick, D. W., Lee, M. T., O’Brien, P. L., Panas, L., Ritter, G. A., Acevedo, A., . . . Godley, M. D. (2012). The Washington Circle engagement performance measures’ association with adolescent treatment outcomes. Drug and Alcohol Dependence, 124(3), 250–8.
- Harris, A. H., Humphreys, K., Bowe, T., Tiet, Q., & Finney, J. W. (2010). Does meeting the HEDIS substance abuse treatment engagement criterion predict patient outcomes? The Journal of Behavioral Health Services & Research, 37(1), 25–39.
- Harris, A. H., Kivlahan, D. R., Bowe, T., Finney, J. W., & Humphreys, K. (2009). Developing and validating process measures of health care quality: an application to alcohol use disorder treatment. Medical Care, 47(12), 1244–50.
- Horgan, C. (2012). Improving the quality of addiction treatment through provider pay-for-performance. Paper presented at the College on Problems of Drug Dependence 74th Annual Scientific Meeting on June 9–14, 2012 in Palm Springs, CA.
- Ivers, N., Jamtvedt, G., Flottorp, S., Young, J. M., Odgaard-Jensen, J., French, S. D., . . . Oxman, A. D. (2012). Audit and feedback: Effects on professional practice and health care outcomes. The Cochrane Database of System Reviews, 6, CD000259.
- James, J. (2012). Health policy brief: Pay-for-performance. Health Affairs. Retrieved from https://www.healthaffairs.org/do/10.1377/hpb20121011.90233/full/
- National Committee for Quality Assurance (NCQA). (2016). Summary table of measures, product lines, and changes. Retrieved from https://www.ncqa.org/wp-content/uploads/2018/08/20150701_HEDIS_2016_List-_of_Measures.pdf
- National Committee for Quality Assurance (NCQA). (2017). Summary table of measures, product lines, and changes. Retrieved from https://www.ncqa.org/wp-content/uploads/2018/07/20170701_HEDIS_2017-Measures.pdf
- National Quality Forum (NQF). (2012). NQF endorses behavioral health measures. Retrieved from http://www.qualityforum.org/News_And_Resources/Press_Releases/2012/NQF_Endorses_Behavioral_Health_Measures.aspx
- Rosenthal, M. B., & Dudley, R. A. (2007). Pay-for-performance: Will the latest payment trend improve care? JAMA, 297(7), 740–4.
- Washington State Department of Social & Health Services (DSHS). (2015). A new statewide study on improving treatment performance: Incentive payment tables. Retrieved from https://www.dshs.wa.gov/sites/default/files/Washington%20Incentives%20Payment%20Tables%2004_21_15.pdf
About Me
Deborah Garnick, ScD, is a professor at the Institute for Behavioral Health at Brandeis University’s Heller School for Social Policy and Management. Her expertise is in the development and application of performance measures, research in the area of role of quality and performance measurement in health care organizations, and investigation of the relationship between system measures and quality.
Constance M. Horgan, ScD, is a professor and director of the Institute for Behavioral Health at Brandeis University’s Heller School for Social Policy and Management. Her research examines how behavioral health services are financed, organized, and delivered, and what approaches can be used to improve the quality and effectiveness of the delivery system. She also leads the Brandeis/Harvard Center to improve system performance of SUD treatment, funded by NIDA.
Margaret Lee, PhD, is a research scientist for the Institute for Behavioral Health at Brandeis University’s Heller School for Social Policy and Management. She has over twenty years of experience working on the development and testing of performance measures.
Grant A. Ritter, PhD, is an associate research professor at the Heller Graduate School for Social Policy and Management, with expertise in the area of quantitative and statistical methods for health services research. As lead statistician on multiple projects, Dr. Ritter’s responsibilities have involved the design of the data collection, the quantitative analyses and related programming, and the interpretation and dissemination of results.
Lee Panas, MS, is a senior statistical programmer at the Schneider Institute for Health Policy. He has expertise in statistical programming and analysis of large state and national databases.
Jason Bean-Mortinson, BA, CDP, has worked in the behavioral health field in Washington State since 2002. During his career, he has provided direct SUD treatment at the outpatient, withdrawal management, and residential levels of care for both adults and adolescents. More recently he has worked at the Department of Social and Health Services and is currently at the Thurston-Mason Behavioral Health Organization as a policy-level manager advocating for publicly funded individuals with behavioral health needs.
Kevin Campbell, DrPH, is a research manager at Washington State’s Department of Social and Health Services, Research and Data Analysis section. His expertise includes the integration and analysis of data from a variety of independently maintained administrative datasets, both at the State and Federal levels. To facilitate linkage of these administrative datasets, he developed a state-of-the-art probabilistic record linkage application: The Link King.
Current Issue


![]() Counselor Magazine is the official publication of the California Association of Addiction Programs and Professionals (CCAPP). Counselor offers online continuing education, article archives, subscription deals, and article submission guidelines. It has been serving the addiction field for more than thirty years.
Counselor Magazine is the official publication of the California Association of Addiction Programs and Professionals (CCAPP). Counselor offers online continuing education, article archives, subscription deals, and article submission guidelines. It has been serving the addiction field for more than thirty years.
For more information on CCAPP’s many programs, certifications, and career paths, please visit ccapp.us.